
 United Kingdom
 France
 Germany
 Netherlands
 Sweden
 USA
USA
 Italy
Italy
 Spain
Spain
More From Contributor


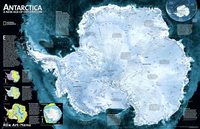
Antarctica Satellite Image Wall Map
A large, striking wall map (143x103cm) derived from remotely sensed data acquired during 1980 - 1987 by the AVHRR sensors on the NOAA 6, 7, 9 and 10 satellites. The images have been corrected and tone-matched to produce this single seamless depiction. Toned in shades of grey/blue, the general relief is portrayed by hill-shading. Major regions, island groups, and sea areas are named, and clouds which could not be eliminated are identified to avoid confusion with terrain features. A polar stereographic graticule of latitude and longitude lines is superimposed over the map, and several national research bases are marked. An inset at 1:17, 500, 000 shows the region in the thermal infrared band, with blue and red tones denoting cooler and warmer areas respectively. A smaller inset map
relates mapped areas to specific satellites and shows the data acquisition times. Explanatory text on the image data and the construction of the image is included.
relates mapped areas to specific satellites and shows the data acquisition times. Explanatory text on the image data and the construction of the image is included.
Product Description
Reviews/Comments
Add New
Intelligent Comparison
Archived Product
Antarctica NGS Satellite Image Wall Map PAPER Stanfords
£14.95
Archived Product
Canada Satellite Image Wall Map Stanfords
£10.99
Archived Product
Antarctica NGS Satellite Image Wall Map ENCAPSULATED Stanfords
£17.99
Archived Product
The Living Earth Satellite Image Wall Map Stanfords
£11.99
Archived Product
Europe And North Africa Satellite Image Wall Map Stanfords
£10.99
Archived Product
New York City Satellite Image Wall Map Stanfords
£10.99
Vouchers
No voucher codes found.
Do you know a voucher code for this product or supplier? Add it to Insights for others to use.
Do you know a voucher code for this product or supplier? Add it to Insights for others to use.
 Denmark